
ChatEstimate
This project aims to develop an intelligent system that combines a chatbot interface with an efficient regression model to predict house prices using machine learning techniques. In addition, the project incorporates the use of the LLMs API (gpt 3.5 turbo), in order to improve the chatbot’s conversational capabilities.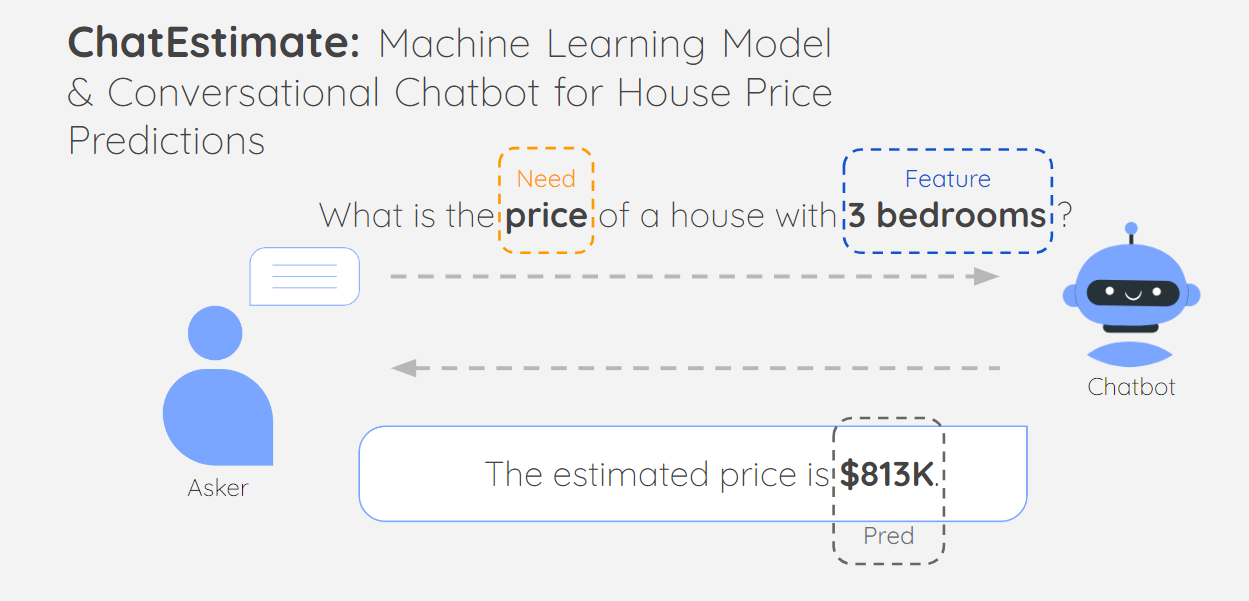
Data Preprocecing
Data Understanding
The dataset used in this project is a CSV file of house prices with the condition of each house, number of bedrooms, bathrooms, and the date of selling, along with other relevant features. Dataset : House Pricing Dataset The project in which this dataset is utilized is a hackathon project organized by the prestigious i2a club. Participants in this hackathon aim to leverage the provided dataset to develop innovative solutions and gain insights into the housing market trends in Seattle, Washington, USA. With a substantial number of houses sold in this region, the dataset offers a robust and diverse set of data points to facilitate comprehensive analysis and model building. By combining their skills and creativity, the participants hope to contribute to the advancement of real estate analytics and contribute meaningful solutions for both buyers and sellers in the dynamic Seattle housing market.
Location of houses on the map: 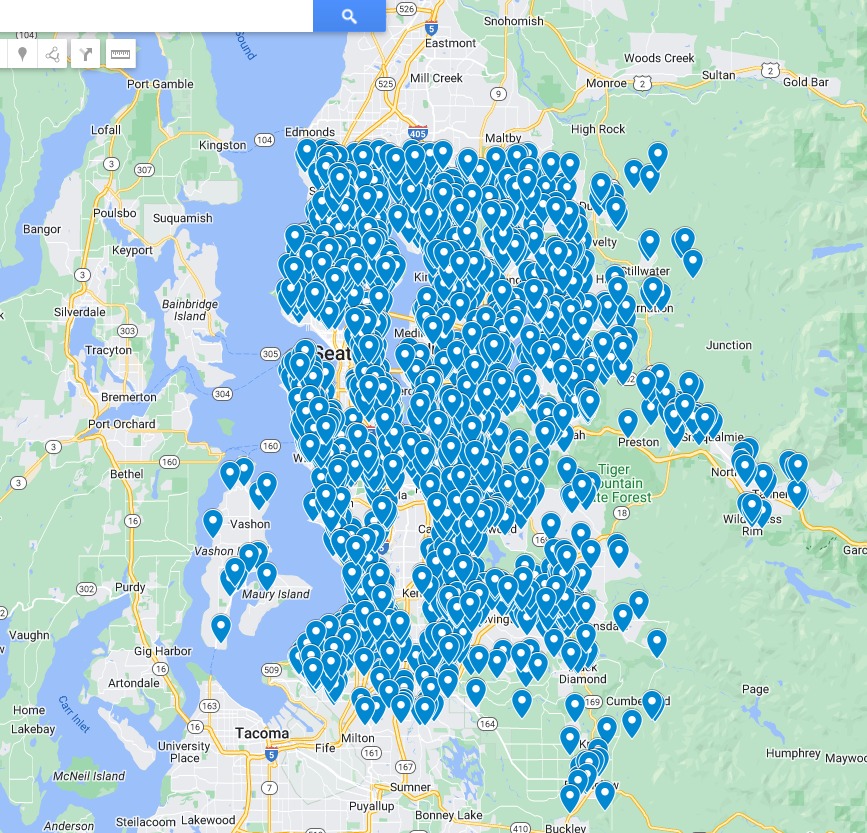
Data Transformation
To analyze the dataset effectively, we initially extracted only the months from the date values to gain insights into the seasonal patterns of house prices. By focusing on the month component of the selling dates, we were able to group the data accordingly and calculate the average house prices for each month. This step allowed us to observe fluctuations in property values over the course of the year and identify any recurring trends or seasonal variations in the housing market. With the extracted monthly data, we then proceeded to create informative visualizations, such as line charts or bar plots, showcasing the average prices in each month.
Average Price of Houses Bought per Month: 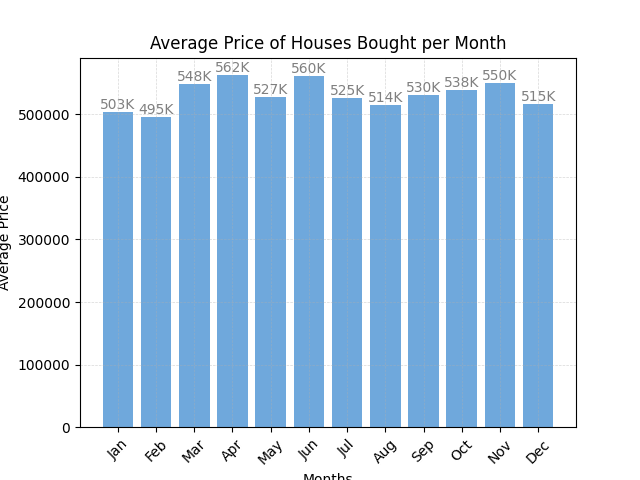
For further data transformation, we focused on the “year of build” attribute in the dataset and converted it into a more relevant feature: the number of years since the house was built. By doing this, we aimed to capture the property’s age, which can be a critical factor in determining its value. To achieve this transformation, we subtracted the “year of build” from the current year to calculate the number of years since the house’s construction.
Transfor the year of building to age of the house: ![]()
The final step in data transformation involved analyzing the frequency of zip codes within the dataset. Zip codes provide valuable geographical information, which can significantly impact house prices. By calculating the occurrence of each zip code in the dataset, we gained a comprehensive understanding of the distribution and prevalence of properties across different regions in Seattle.
Data Visualisation
One of the most crucial visualizations in our analysis was the representation of the number of houses sold in each category within the dataset. This visualization allowed us to examine the distribution of property types and assess their impact on house prices. From the visualization, we observed that the category “c3” emerged as the highest-selling property type, accounting for a significant percentage of 65% of the total sales. Following closely was the category “c4,” constituting 26% of the sales. These findings strongly suggest that the house category indeed has a direct influence on the house prices, with certain categories being more sought after by buyers, leading to higher demand and potentially higher prices. Understanding the relationship between house categories and their corresponding prices is crucial for making informed decisions in the real estate market. This visualization highlighted the importance of considering the specific attributes and features associated with each category when assessing property values, providing valuable insights for prospective buyers and sellers alike.
Number of houses sold by condition: 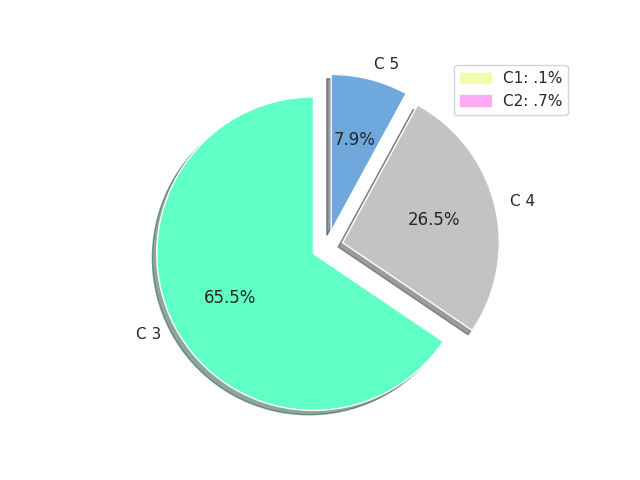
Model Selection & Result
In the model selection phase, we rigorously experimented with various regression algorithms, including “SVM regression,” “linear regression,” and several others, to predict house prices accurately. Our objective was to identify the model that provided the most precise and reliable predictions. After thorough evaluation, we found that the “CatBoost” algorithm outperformed all others, delivering exceptional results with an impressive R² value of 91.31%. The R² value indicates the proportion of variance in the target variable (house prices) that is explained by the model, and a value of 91.31% signifies a highly accurate and well-fitted model. The figure we present depicts the performance of each utilized algorithm, clearly demonstrating the superiority of CatBoost in comparison to its counterparts. This success highlights the importance of employing advanced gradient boosting techniques, like CatBoost, in predicting house prices, as they offer powerful capabilities to capture complex patterns and relationships within the data, leading to superior predictive performance and informed decision-making in the ever-changing real estate market.
Model Resules: 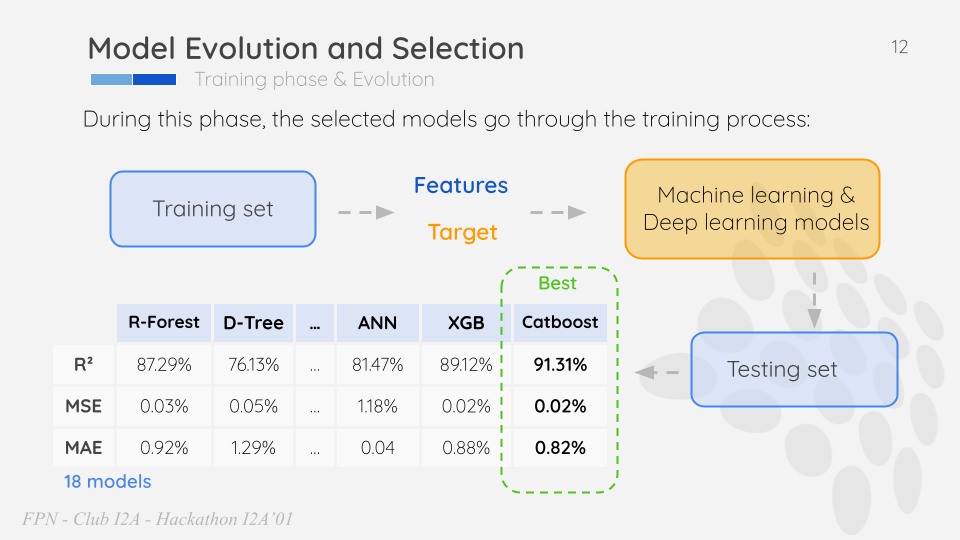
LLM to extract data from user messages
In our project, we aimed to develop an intelligent and interactive system capable of extracting relevant data from users’ messages to enhance the user experience. For this purpose, we initially integrated the “LLM” (Language Model for Message Extraction), a custom-built language model tailored to efficiently extract specific information from user inputs. However, as our project progressed, we explored other language models to optimize data extraction further. We experimented with “LLAMA,” “FALCON,” and finally, the powerful “ChatGPT-3.5 Turbu API” developed by OpenAI. Each model offered unique strengths, but ultimately, we found that the ChatGPT-3.5 Turbu API provided the most robust and accurate data extraction capabilities.
In our project, we strived to develop a comprehensive and adaptable system that accommodates various user inputs. To ensure the robustness of our data processing pipeline, we encountered situations where users might not have entered all the required training features. In such cases, we implemented the “K-Nearest Neighbors” (KNN) algorithm to fill in the missing values effectively. KNN is a reliable and simple imputation technique that estimates missing feature values based on the values of neighboring data points in the dataset.
Use prompt engineering to communicate with users: 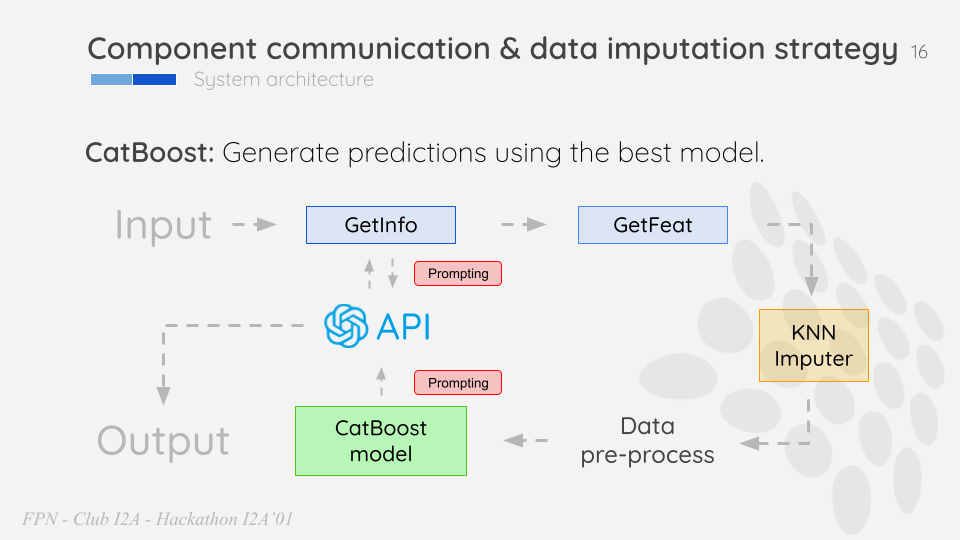
Model deployment
We are thrilled to introduce our new Flask web application, designed to make the process of estimating house prices a seamless and user-friendly experience. With our intuitive interface, users can easily input their property-related details, such as the number of bedrooms, bathrooms, house condition, and other essential features. In case users miss providing some information, our smart application incorporates the power of K-Nearest Neighbors (KNN) imputer to fill in the missing values accurately. The KNN algorithm leverages the data from similar properties to estimate the missing attributes, ensuring a comprehensive and precise analysis. Once all the necessary information is provided, our application utilizes an advanced regression model, such as CatBoost with an R² value of 91.31%, to compute the estimated price of the house. Finally, the result is swiftly returned to the user, offering an instant and reliable estimate for the property’s value. With our innovative Flask web application, estimating house prices has never been easier and more efficient!
Chat interface: 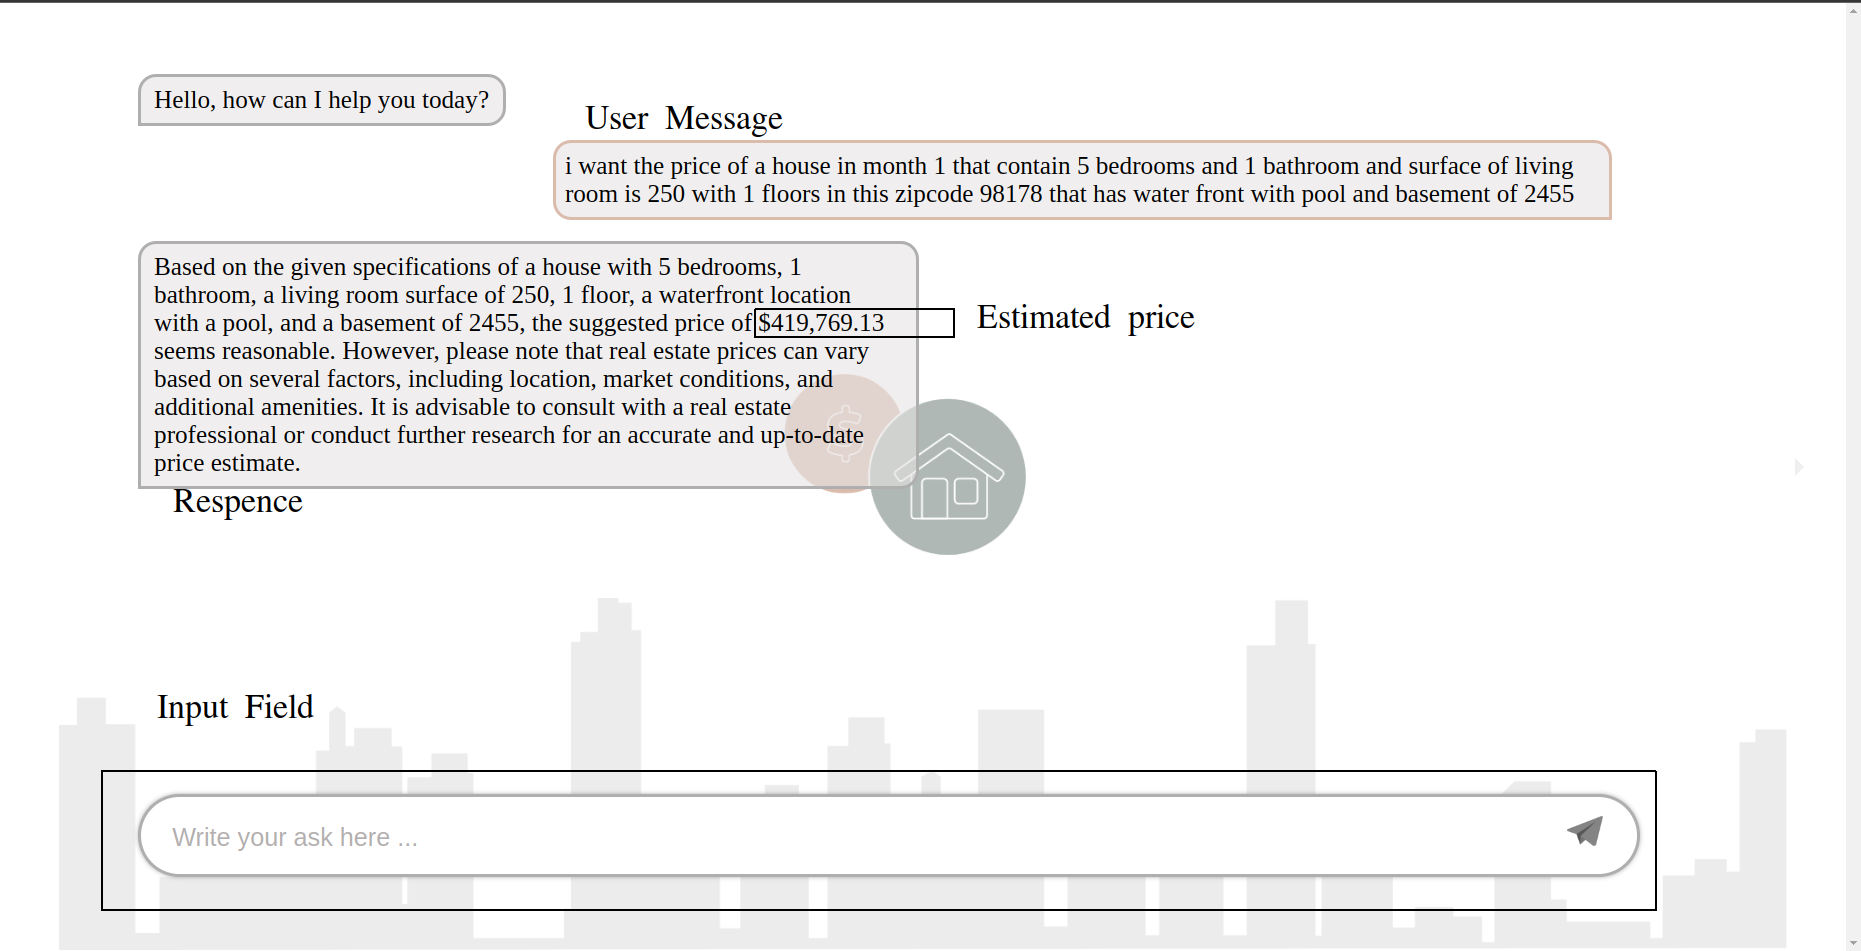
Project URL on github: jboussouf/ChatEstimate